1
Derivatives Rollover Report |March 26, 2021
For Private Circulation Only
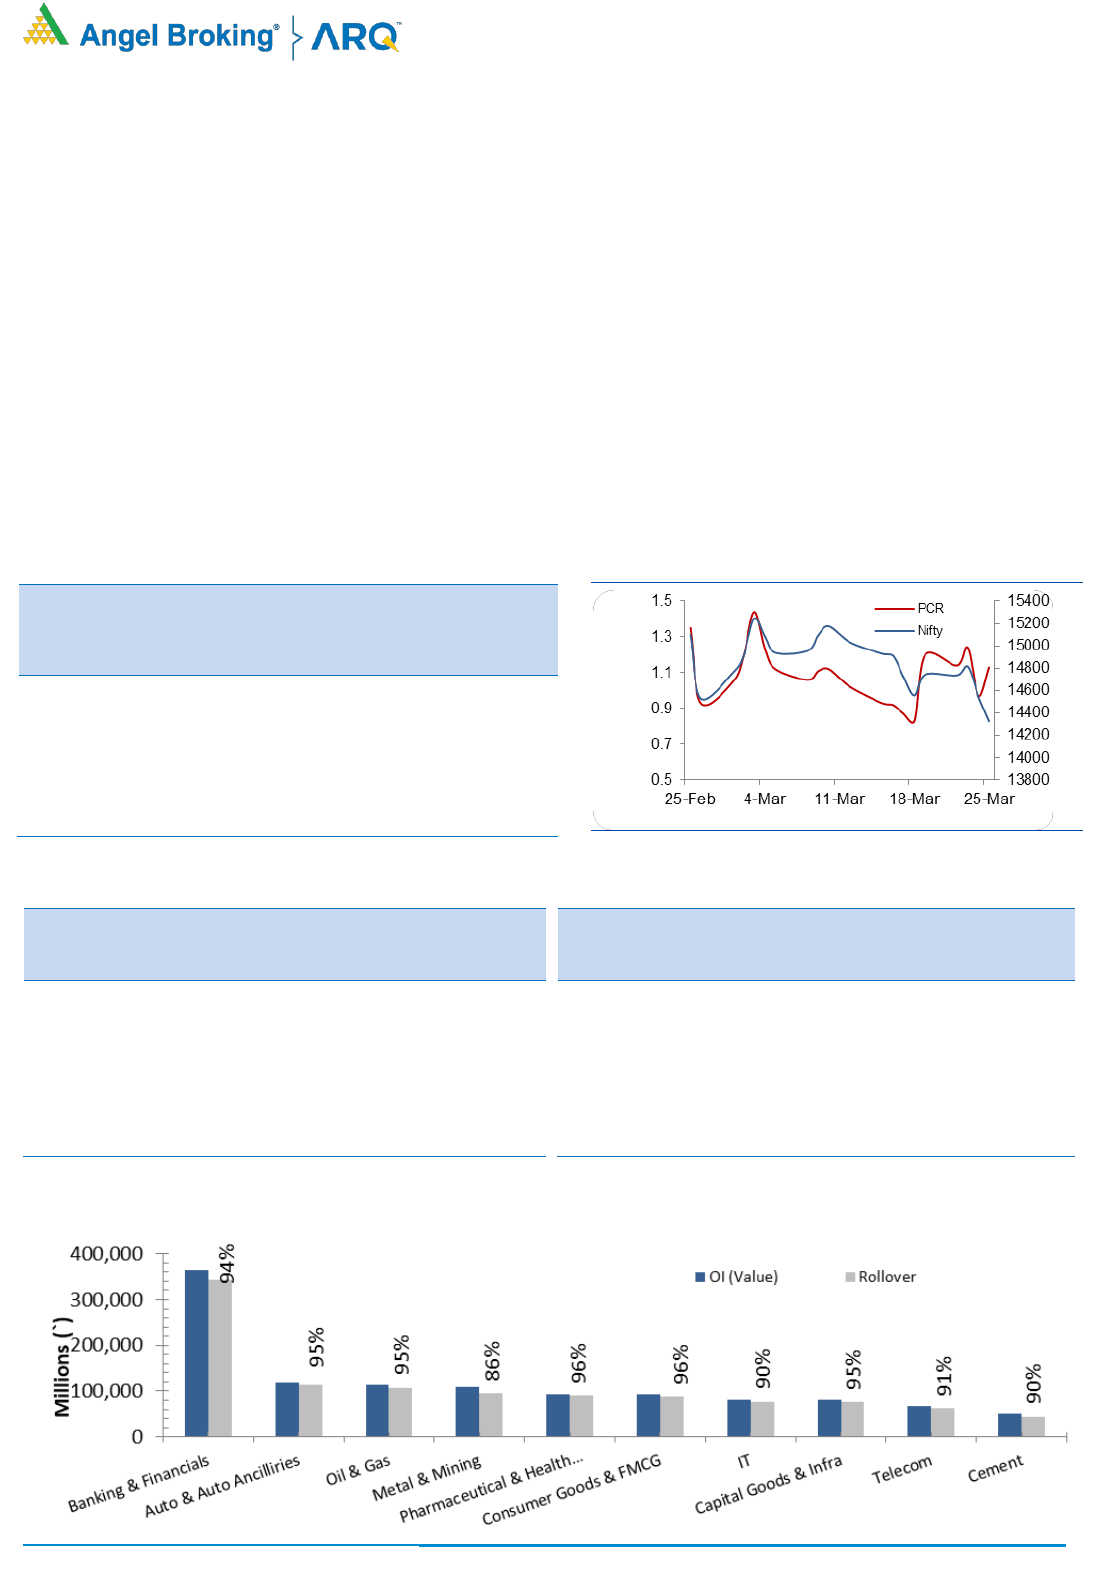
NIFTY & PCR Graph
Monthly Gainers
Scrip
Price
Price
Change
(%)
Open
Interest
Ol
Change
(%)
MINDTREE
1986.65
23.14
1436000
25.44
ADANIENT
990.45
16.59
15326000
(14.29)
COFORGE
2777.85
10.06
456750
43.97
GRASIM
1385.15
8.48
15308300
(5.23)
AARTIIND
1325.70
6.60
412675
5.89
Note: Stocks which have more than 1000 contract in Futures OI.
Monthly Losers
Scrip
Price
Price
Change
(%)
Open
Interest
Ol
Change
(%)
IDEA
9.15
(22.13)
329910000
(61.10)
BANKBARODA
70.65
(18.51)
110541600
25.62
MANAPPURAM
149.65
(17.07)
19998000
7.20
ASHOKLEY
110.65
(16.21)
41337000
8.81
BEL
119.55
(15.90)
41344000
41.59
Note: Stocks which have more than 1000 contract in Futures OI.
Post the fabulous run in the February series; we started very first day of the March series with a downside gap and sneaked below the 14500
mark. However, decent recovery was seen thereafter to reclaim 15300 mark. At these higher levels, the benchmark index lacked momentum
and hence, bears took charge resulting in Nifty correcting below the lows hit on the first day of March series (14467.75). In fact, pullback
moves in between also got sold into during last week and the index plunged below 14300. Finally, we concluded the last series of the financial
year 2020-2021 slightly above 14300 mark and with a cut of almost 5%.
Now let’s see how things shaped up in F&O space, throughout the series we hardly saw any meaningful open interest activity in Nifty;
however, the banking index added decent shorts during every price correction. Rollover in Nifty futures stood at 82%, indeed very much
above 3 month averages. On the face of it may appear short rollover but if we glance at month of month change in open interest, there has
been some reduction which clearly suggests we are beginning new financial year with lower base. Unlike Nifty, the banking index added huge
shorts in March series and a rollover of 88% indicates majority of them have been carried forward too. Considering the quantum of
outstanding positions in BankNifty; some recovery in the coming week can’t be ruled out. As far as FIIs activities are concerned, since last few
days the consistency in their activity seems missing a bit as we can see one or two days buying figures and then opposite to it. On a net basis,
they have been net buyers to the tune of Rs. 2212 crores. In derivatives segment, they preferred exiting longs and rolling over bearish bets.
Hence, their long short ratio has plunged from 76% to 62% MoM. As we are starting new series with lower OI base, we would prefer staying
light until any meaningful positions are formed in either direction.
Indices Change
INDEX
Price
Price
Change
(%)
Rollover
3 month
avg.
NIFTY
14324.90
(4.84)
81.67
79.06
BANKNIFTY
33006.45
(9.28)
88.18
80.16
FINNIFTY
15474.75
(8.02)
40.73
48.73
-
-
-
-
-
-
-
-
-
-
Derivatives Rollover Report
For Private Circulation Only
2
Scrip
Price
Price
Change
(%)
OI Futures
OI
Change
(%)
COC (%)
PCR-OI
Rollover
(%)
Average
Rollover
(3month)
(%)
AUTO & AUTO ANCILLARIES
AMARAJABAT
850.90
(4.51)
2211000
(23.92)
7.16
1.58
96.93
94.91
APOLLOTYRE
220.25
(9.03)
9395000
(34.73)
5.71
0.69
91.84
92.30
ASHOKLEY
110.65
(16.21)
41337000
8.81
8.07
0.87
92.62
90.99
BAJAJ-AUTO
3533.80
(10.87)
2132750
34.86
9.59
0.50
95.39
91.64
BALKRISIND
1612.20
1.57
1711600
(31.11)
3.90
1.65
96.61
88.33
BHARATFORG
574.05
(7.97)
5122500
(22.74)
6.40
0.72
96.01
94.77
BOSCHLTD
13789.50
(9.09)
85750
(13.08)
7.76
3.76
97.78
96.63
EICHERMOT
2603.75
1.54
2309650
(15.44)
9.42
1.00
96.35
93.85
ESCORTS
1277.10
(2.89)
1736350
(37.68)
8.89
1.05
94.55
95.72
EXIDEIND
181.80
(12.93)
12880800
3.20
4.03
1.14
94.28
93.13
HEROMOTOCO
2953.80
(13.47)
3450000
0.27
4.31
0.79
92.79
94.59
M&M
799.00
(7.62)
7662200
(9.15)
9.62
0.68
92.37
90.40
MARUTI
6839.65
(2.02)
2271500
(27.38)
8.12
0.72
94.74
95.18
MOTHERSUMI
197.05
(10.10)
28385000
(8.22)
5.32
0.72
94.46
94.44
MRF
82412.20
(6.44)
41710
(20.55)
8.47
0.87
92.46
94.47
TATAMOTORS
288.05
(14.14)
91262700
13.90
9.13
0.89
95.78
93.09
TVSMOTOR
556.80
(7.21)
2846200
(31.11)
-2.71
1.05
93.09
92.81
BANKING & FINANCIALS
AUBANK
1160.85
#N/A
690000
#N/A
9.52
0.83
84.04
#N/A
AXISBANK
700.55
(9.51)
33850800
(8.13)
8.93
0.93
96.36
91.31
BAJAJFINSV
9129.50
(11.59)
562500
3.19
8.28
0.94
95.14
94.55
BAJFINANCE
5163.05
(7.24)
3529750
(6.71)
8.32
0.89
97.22
89.75
BANKBARODA
70.65
(18.51)
110541600
25.62
8.93
0.64
78.77
85.35
CANBK
144.75
(11.93)
54896400
2.42
9.82
0.97
96.92
97.45
CHOLAFIN
541.75
3.06
4452500
(12.87)
8.25
0.51
95.19
91.87
CUB
162.05
#N/A
7074200
#N/A
8.11
1.33
95.80
#N/A
FEDERALBNK
76.85
(11.57)
68850000
(16.21)
7.52
0.64
93.58
94.88
HDFC
2489.05
(7.74)
13932600
(10.22)
7.72
0.87
95.58
92.40
HDFCBANK
1476.15
(8.42)
23051050
7.68
9.12
0.72
95.70
95.71
IBULHSGFIN
197.30
(13.20)
29211300
(14.86)
9.06
1.00
92.89
94.84
ICICIBANK
576.30
(8.87)
90872375
(15.50)
8.67
0.67
97.47
96.99
ICICIPRULI
431.70
(10.23)
7021500
0.41
4.00
0.67
94.13
95.78
INDUSINDBK
965.95
(13.55)
21854700
(3.87)
8.87
1.15
94.99
93.90
KOTAKBANK
1777.05
(6.80)
11308000
(10.93)
8.37
0.73
92.05
89.95
L&TFH
94.65
(11.38)
27182504
(24.30)
8.89
0.80
85.27
84.70
LICHSGFIN
415.25
(8.65)
5918000
(40.02)
6.19
0.57
96.26
94.12
M&MFIN
194.35
(10.04)
13428000
(0.59)
-9.04
0.73
94.75
94.05
Derivatives Rollover Report
For Private Circulation Only
3
Scrip
Price
Price
Change
(%)
OI Futures
OI
Change
(%)
COC (%)
PCR-OI
Rollover
(%)
Average
Rollover
(3month)
(%)
MFSL
852.95
(4.51)
2072200
(31.47)
7.70
0.45
95.85
93.83
MUTHOOTFIN
1190.25
(10.55)
2592000
(8.98)
2.81
2.78
90.61
87.55
NAM-INDIA
327.65
#N/A
744000
#N/A
1.43
0.70
86.59
#N/A
PFC
114.40
(12.10)
32122200
(9.55)
7.34
0.80
95.98
89.44
PNB
35.70
(15.20)
198688000
26.17
5.88
0.80
90.70
88.31
RBLBANK
211.40
(15.63)
19398100
8.84
6.70
1.17
87.20
81.75
RECLTD
131.75
(8.25)
15102000
(14.39)
7.98
0.86
88.72
84.41
SBIN
358.35
(12.51)
87375000
5.92
9.25
0.71
94.07
94.13
SRTRANSFIN
1376.65
(0.94)
3174400
(17.68)
3.57
0.45
93.30
90.92
CAPITAL GOODS & INFRASTRUCTURE
ADANIPORTS
693.85
(2.07)
58770000
9.09
8.49
0.51
95.26
88.81
BHEL
48.60
2.32
90573000
(27.23)
8.65
0.63
90.21
93.92
GMRINFRA
24.05
(10.93)
148522500
0.55
6.55
0.56
87.66
94.85
HAVELLS
1032.45
(12.51)
4763000
47.37
6.35
0.66
95.62
93.80
LT
1383.00
(8.84)
12694275
3.03
9.05
0.93
95.45
94.89
SIEMENS
1812.35
(5.64)
598950
(18.37)
5.70
0.79
93.88
89.73
VOLTAS
967.35
(8.25)
3161000
23.62
9.52
0.53
94.95
91.76
CEMENT
ACC
1854.00
2.33
3028500
10.31
2.25
0.73
97.16
95.32
AMBUJACEM
296.90
6.00
14796000
4.76
9.93
0.60
96.46
90.92
GRASIM
1385.15
8.48
15308300
(5.23)
9.38
0.95
81.89
92.71
RAMCOCEM
955.30
(3.69)
1716150
1.56
6.37
0.07
92.91
94.03
SHREECEM
27736.00
0.45
125050
4.64
5.90
0.29
98.85
89.94
ULTRACEMCO
6728.40
4.54
1574200
5.44
9.68
0.43
96.14
96.10
CHEMICAL & FERTILIZERS
PIDILITIND
541.95
(5.51)
851000
35.73
8.05
0.33
74.71
71.65
TATACHEM
434.45
4.36
4853200
9.42
8.35
0.78
91.19
91.58
UPL
433.55
(9.37)
8288000
39.98
7.63
0.66
88.39
86.74
ASIANPAINT
738.55
3.97
5346500
1.00
14.06
0.46
84.48
81.93
COLPAL
1773.00
(6.01)
898875
4.81
12.04
0.18
86.06
85.08
DABUR
231.25
(5.80)
1755000
(51.71)
12.65
0.37
66.43
77.82
HINDUNILVR
764.40
(3.76)
5360500
5.81
9.91
0.58
83.78
75.77
ITC
376.00
3.50
30792000
13.77
12.56
0.55
83.76
72.37
JUBLFOOD
1360.60
(6.59)
2033750
4.13
-0.37
1.93
93.04
90.97
MCDOWELL-N
2368.50
(0.87)
4327875
(46.85)
6.97
0.56
76.88
71.90
MCLEODRUSS
282.55
8.38
2770000
(12.31)
4.92
0.75
76.63
89.24
TATAGLOBAL
140.95
(0.56)
18010000
(4.40)
10.35
0.56
92.05
89.07
CHEMICALS & FERTILIZERS
DEEPAKNTR
1543.10
#N/A
706000
#N/A
6.08
0.60
92.11
#N/A
PIDILITIND
1774.35
2.54
1839500
(19.53)
5.88
0.40
98.21
97.57
TATACHEM
737.50
(0.08)
8754000
0.07
9.20
0.69
93.91
92.37
UPL
601.50
0.96
18257200
0.17
10.24
0.49
97.55
96.43
CONCOR
556.00
(5.86)
7139784
40.51
7.43
0.32
99.05
94.03
CUMMINSIND
550.20
0.79
1871300
(0.55)
6.91
1.39
96.43
95.05
INDIGO
1441.15
(1.56)
2830800
(7.14)
6.91
0.68
96.45
88.50
JUSTDIAL
571.85
(3.36)
2202200
(17.90)
6.64
1.59
89.27
88.23
OIL & GAS
BPCL
512.45
(3.06)
26031600
34.02
6.26
0.65
98.66
93.25
GAIL
126.10
(8.19)
52849272
23.11
3.11
0.47
95.27
94.36
HINDPETRO
291.40
(10.71)
21789600
10.47
3.14
1.25
98.39
91.80
Consumer Goods & FMCG
ASIANPAINT
2418.35
1.16
5478900
(16.13)
7.01
0.52
98.18
88.87
BERGEPAINT
738.65
1.44
2968900
(7.25)
5.89
0.25
97.61
96.81
BRITANNIA
3460.35
1.36
1839400
(27.51)
4.98
0.61
93.36
95.06
COLPAL
1523.35
(3.36)
3277400
8.15
-4.70
0.81
96.92
97.77
CONCOR
556.00
(5.86)
7139784
40.51
7.43
0.32
99.05
94.03
CUMMINSIND
550.20
0.79
1871300
(0.55)
6.91
1.39
96.43
95.05
Derivatives Rollover Report
For Private Circulation Only
4
Scrip
Price
Price
Change
(%)
OI Futures
OI
Change
(%)
COC (%)
PCR-OI
Rollover
(%)
Average
Rollover
(3month)
(%)
DABUR
521.25
2.01
8237500
(16.41)
7.86
0.29
97.67
96.28
GODREJCP
683.90
(2.43)
5256000
12.28
6.29
0.39
98.04
92.43
97.08
HINDUNILVR
2256.80
3.63
5230500
(38.73)
9.21
1.03
94.63
95.61
98.06
ITC
212.70
1.07
105545600
(22.22)
5.42
0.54
96.42
94.49
96.24
JUBLFOOD
2850.95
(7.25)
1225500
(10.78)
9.73
0.34
96.71
94.11
97.07
MARICO
400.25
(2.23)
6810000
14.53
5.90
0.66
97.93
88.89
96.04
MCDOWELL-N
549.70
0.27
13398750
(5.44)
6.30
0.63
97.91
96.81
NESTLEIND
16235.85
0.09
288800
(22.08)
4.23
1.05
88.48
94.15
95.18
TATACONSUM
618.20
(2.37)
11115900
(15.93)
5.68
0.41
95.95
96.34
97.08
TITAN
1463.75
1.32
5707500
(13.18)
9.27
1.26
96.37
94.89
98.06
UBL
1217.85
1.25
945700
(20.11)
0.73
0.51
70.44
79.06
96.24
MEDIA
DISHTV
13.35
(11.88)
95013000
(6.31)
14.81
0.46
93.85
92.83
PVR
1828.55
1.92
865200
(20.59)
5.15
0.62
91.34
88.69
SUNTV
448.35
(8.42)
3636000
30.53
9.22
1.64
92.03
90.57
ZEEL
298.80
(4.38)
27648800
(9.61)
6.58
0.84
91.85
83.77
COALINDIA
293.80
1.71
14714400
2
9
.
8
0
8.26
0.35
63.04
65.79
HINDALCO
88.10
30.23
34330000
(
1
3
.
3
6
)
2.22
0.61
78.46
82.59
HINDZINC
182.40
10.61
3964800
1
0
8
.
5
9
-8.52
0.34
71.17
74.01
JINDALSTEL
60.45
11.12
32228000
(
9
.
0
1
)
4.33
0.32
80.34
78.99
JSWSTEEL
(
1
9
.
0
METALS & MINING
COALINDIA
129.20
(15.28)
40618200
(1.33)
8.96
0.55
84.18
85.11
HINDALCO
316.50
(9.76)
27674800
15.73
8.30
0.58
93.82
88.65
JINDALSTEL
311.85
(10.19)
28640000
26.84
8.77
0.83
96.99
95.94
JSWSTEEL
442.00
4.15
33004800
10.35
9.52
0.41
98.40
96.37
NATIONALUM
52.55
(8.37)
61557000
(2.45)
11.03
0.82
93.40
86.38
NMDC
125.35
(2.30)
39623800
(20.49)
10.93
0.76
85.38
86.29
SAIL
73.00
(0.95)
125628000
28.07
10.83
0.84
94.90
77.79
TATASTEEL
728.90
(2.49)
40108100
(0.22)
8.29
0.71
97.51
93.99
VEDL
222.90
6.22
74660400
(22.29)
1.87
1.00
59.28
84.05
Media
PVR
1239.40
(12.75)
1405371
(16.55)
0.13
1.72
94.68
93.30
SUNTV
455.80
(11.20)
11760000
5.42
9.70
0.94
94.37
91.55
ZEEL
197.90
(5.83)
46419000
34.03
9.57
0.84
97.07
97.03
TEXTILES
ARVIND
66.40
(15.36)
5862000
(11.53)
5.92
1.09
82.52
89.16
CENTURYTEX
959.75
(7.62)
3744000
5.98
-1.70
0.81
98.89
99.06
INFORMATION TECHNOLOGY
COFORGE
2777.85
10.06
456750
43.97
9.99
0.75
88.45
92.65
HCLTECH
963.05
3.27
16171400
(11.66)
6.54
0.75
96.59
96.64
INFY
1345.70
4.86
27843000
(13.53)
9.30
0.65
95.85
96.66
LTI
3861.45
#N/A
233400
#N/A
6.58
0.51
95.05
#N/A
LTTS
2507.45
#N/A
450200
#N/A
6.19
3.17
96.49
#N/A
MPHASIS
1681.20
#N/A
327275
#N/A
5.05
0.55
96.18
#N/A
MINDTREE
1986.65
23.14
1436000
25.44
9.08
0.42
90.89
94.06
TCS
3091.90
2.84
6890400
(2.97)
9.19
1.07
96.08
94.24
TECHM
977.00
1.37
10735200
1.19
8.88
0.58
97.40
95.99
WIPRO
403.30
(4.43)
31904000
7.46
9.52
0.65
93.14
94.67
TELECOM
BHARTIARTL
350.55
0.39
34602594
(4.18)
7.10
0.90
89.38
87.82
IDEA
12.45
(7.43)
363300000
(10.52)
10.56
0.83
82.76
85.28
INFRATEL
276.95
1.58
6836000
3.14
10.20
0.49
84.58
83.89
TEXTILES
ARVIND
66.40
(15.36)
5862000
(11.53)
5.92
1.09
82.52
89.16
CENTURYTEX
959.75
(7.62)
3744000
5.98
-1.70
0.81
98.89
99.06
PAGEIND
20491.75
6.10
156325
9.82
-9.51
0
96.19
89.39
RAYMOND
739.95
(13.35)
2732800
4.75
7.00
1.38
97.21
96.63
SRF
3044.00
4.24
923500
9.81
8.82
0.56
95.08
96.97
MEDIA
DISHTV
31.30
(14.36)
79358000
36.60
10.50
0.80
90.60
90.38
PVR
1761.85
2.35
686000
(1.21)
-9.55
0.77
94.75
94.46
SUNTV
549.00
(5.52)
6148000
(0.26)
8.72
0.63
92.24
91.73
TV18BRDCST
29.25
(12.56)
44369000
(32.71)
2.23
0.44
94.15
94.99
ZEEL
367.90
(12.44)
20372300
18.63
9.46
0.47
97.35
90.61
Derivatives Rollover Report
For Private Circulation Only
5
Scrip
Price
Price
Change
(%)
OI Futures
OI
Change
(%)
COC (%)
PCR-OI
Rollover
(%)
Average
Rollover
(3month)
(%)
INFORMATION TECHNOLOGY
HCLTECH
564.00
(0.70)
22885800
(1.26)
8.14
0.58
98.56
96.78
INFY
730.55
3.77
24351600
(52.50)
2.86
0.74
55.98
79.52
MINDTREE
782.95
10.93
1041600
(14.29)
-15.63
0.59
93.13
93.37
NIITTECH
1606.65
6.68
578250
26.08
-2.03
0.46
89.76
82.99
TCS
2212.80
6.19
15671500
(17.22)
6.42
1.91
95.02
94.74
TECHM
775.75
1.00
15406800
8.21
9.05
0.65
96.29
97.15
WIPRO
249.90
3.65
18211200
(29.64)
-2.08
0.72
83.12
92.60
MISCELLANIOUS
ADANIENT
990.45
16.59
15326000
(14.29)
9.46
0.60
93.09
95.26
APOLLOHOSP
2831.25
(8.60)
1501500
12.89
8.15
0.38
97.25
92.93
BATAINDIA
1435.60
(3.57)
1110450
(31.26)
4.19
1.35
93.78
93.27
BEL
119.55
(15.90)
41344000
41.59
2.62
0.60
94.13
92.56
CONCOR
553.85
(4.38)
5531457
(7.84)
7.40
1.30
96.38
92.11
CUMMINSIND
844.55
4.36
1533600
5.71
-13.41
0.51
93.08
91.76
INDIGO
1661.85
(0.29)
3410000
8.60
-1.07
0.84
98.02
97.15
OIL & GAS
BPCL
422.65
(8.74)
45961200
117.72
9.21
1.02
89.12
87.79
GAIL
129.05
(14.82)
24625700
(17.80)
8.55
0.61
92.61
89.14
GUJGASLTD
516.25
#N/A
1077500
#N/A
9.07
0.33
94.41
#N/A
HINDPETRO
229.05
(9.45)
26605800
(26.00)
8.26
1.33
91.08
90.45
IGL
506.15
(1.77)
5178250
(23.81)
7.68
1.13
97.21
91.91
IOC
91.70
(9.79)
62803000
(12.25)
9.18
0.66
93.34
91.89
MGL
1142.20
(4.95)
1020000
(34.79)
1.01
0.96
95.18
90.39
ONGC
102.90
(13.13)
38269000
(13.29)
9.20
0.69
92.19
84.88
PETRONET
222.20
(14.51)
18006000
4.88
6.85
0.92
96.78
95.76
RELIANCE
2008.90
(6.90)
26297500
(1.73)
9.11
0.63
97.62
95.78
BATAINDIA
1444.10
8.68
1488850
(10.54)
-2.88
0.42
93.06
94.61
BEL
115.85
1.49
22602000
(2.49)
10.21
0.44
97.34
96.42
MCX
659.60
(6.88)
2102100
(7.23)
11.16
0.79
93.26
90.88
MCX
1111.60
2.65
1348000
12.33
-3.27
0.66
92.87
80.54
PHARMACEUTICAL
ALKEM
2663.90
#N/A
234800
#N/A
9.30
0.81
98.00
#N/A
APLLTD
932.75
#N/A
510950
#N/A
7.26
0.93
98.62
#N/A
AUROPHARMA
844.60
(2.59)
8495500
(9.13)
5.52
0.57
96.05
92.66
BIOCON
400.00
(0.10)
12686800
(13.68)
3.53
0.91
97.39
95.85
CADILAHC
423.70
(3.65)
9702000
(8.37)
8.69
0.51
96.65
96.17
CIPLA
790.05
(2.64)
10721100
(6.00)
3.71
0.56
93.28
95.52
DIVISLAB
3468.05
0.10
2528400
(16.97)
5.43
0.86
98.18
96.69
DRREDDY
4405.00
(2.39)
3245500
0.46
5.81
0.67
97.26
97.00
GRANULES
307.70
#N/A
5229700
#N/A
8.89
0.37
94.09
#N/A
GLENMARK
448.10
(5.87)
5464800
(6.79)
9.75
0.54
90.34
92.66
LUPIN
997.90
(2.94)
5413650
(31.03)
5.99
0.84
87.29
93.40
PEL
1807.10
(7.79)
2833600
(20.64)
8.23
0.37
96.44
94.24
PFIZER
4444.70
#N/A
52750
#N/A
9.52
0.59
96.57
#N/A
SUNPHARMA
580.15
(5.34)
41245400
0.61
7.97
0.73
97.68
95.88
TORNTPHARM
2457.75
(0.93)
855250
(17.86)
5.97
0.44
97.77
97.24
OIL & GAS
BPCL
512.45
(3.06)
26031600
34.02
6.26
0.65
98.66
93.25
GAIL
126.10
(8.19)
52849272
23.11
3.11
0.47
95.27
94.36
HINDPETRO
291.40
(10.71)
21789600
10.47
3.14
1.25
98.39
91.80
Derivatives Rollover Report
For Private Circulation Only
6
Scrip
Price
Price
Change
(%)
OI Futures
OI
Change
(%)
COC (%)
PCR-OI
Rollover
(%)
Average
Rollover
(3month)
(%)
POWER
NTPC
103.95
(4.41)
74755500
(9.25)
9.62
0.61
93.16
86.57
POWERGRID
218.30
(2.70)
11828000
6.71
8.91
0.63
62.40
66.74
TATAPOWER
99.40
2.90
134419500
(0.89)
7.93
0.84
96.50
95.68
TORNTPOWER
413.15
5.25
2226000
(30.20)
6.09
0.22
92.52
93.26
REAL ESTATE
DLF
279.45
(11.54)
23205600
(5.47)
9.22
0.84
94.62
91.93
TELECOM
BHARTIARTL
512.05
(11.82)
98845251
18.91
8.83
0.70
96.34
94.12
IDEA
9.15
(22.13)
329910000
(61.10)
29.29
0.85
49.24
78.47
TEXTILES
PAGEIND
29451.65
1.92
52950
(35.01)
9.39
0.00
98.93
94.53
SRF
5286.25
(5.18)
302625
8.18
6.59
0.32
96.49
96.08
CENTURYTEX
487.95
4.96
3472200
3.19
9.28
0.26
98.91
84.95
PAGEIND
22340.05
0.42
115325
(20.02)
3.23
0.00
90.77
89.33
POWER
ADANIPOWER
51.75
(0.38)
131920000
(3.16)
6.33
0.68
98.37
95.34
CESC
788.45
5.04
1217600
(14.52)
10.16
0.05
96.98
94.18
NTPC
140.85
3.57
63643200
46.15
6.51
0.42
74.18
71.71
POWERGRID
208.95
8.77
31196000
46.96
7.85
0.98
86.83
81.73
TATAPOWER
69.25
(0.22)
53307000
(2.47)
11.39
0.95
92.66
92.57
TORNTPOWER
280.50
13.36
4017000
90.20
-26.19
1.31
84.48
88.46

Derivatives Rollover Report
For Private Circulation Only
7
Technical and Derivatives Team:
Sameet Chavan Chief Analyst - Technical & Derivatives sameet.chavan@angelbroking.com
Ruchit Jain Senior Analyst - Technical & Derivatives ruchit.jain@angelbroking.com
Rajesh Bhosale Technical Analyst rajesh.bhosle@angelbroking.com
Research Team Tel: 022 - 39357600 (EXTN - 6844) Website: www.angelbroking.com
For Technical & Derivative Queries E-mail: technicalresearch-cso@angelbroking.com
DISCLAIMER
Angel Broking Limited (hereinafter referred to as “Angel”) is a registered Member of National Stock Exchange of India Limited,
Bombay Stock Exchange Limited and Metropolitan Stock Exchange Limited. It is also registered as a Depository Participant with
CDSL and Portfolio Manager and Investment Adviser with SEBI. It also has registration with AMFI as a Mutual Fund Distributor.
Angel Broking Limited is a registered entity with SEBI for Research Analyst in terms of SEBI (Research Analyst) Regulations, 2014
vide registration number INH000000164. Angel or its associates has not been debarred/ suspended by SEBI or any other regulatory
authority for accessing /dealing in securities Market. Angel or its associates/analyst has not received any compensation / managed
or co-managed public offering of securities of the company covered by Analyst during the past twelve months.
This document is solely for the personal information of the recipient, and must not be singularly used as the basis of any
investment decision. Nothing in this document should be construed as investment or financial advice. Each recipient of this
document should make such investigations as they deem necessary to arrive at an independent evaluation of an investment in the
securities of the companies referred to in this document (including the merits and risks involved), and should consult their own
advisors to determine the merits and risks of such an investment.
Reports based on technical and derivative analysis center on studying charts of a stock's price movement, outstanding positions
and trading volume, as opposed to focusing on a company's fundamentals and, as such, may not match with a report on a
company's fundamentals. Investors are advised to refer the Fundamental and Technical Research Reports available on our website
to evaluate the contrary view, if any.
The information in this document has been printed on the basis of publicly available information, internal data and other reliable
sources believed to be true, but we do not represent that it is accurate or complete and it should not be relied on as such, as this
document is for general guidance only. Angel Broking Limited or any of its affiliates/ group companies shall not be in any way
responsible for any loss or damage that may arise to any person from any inadvertent error in the information contained in this
report. Angel Broking Limited has not independently verified all the information contained within this document. Accordingly, we
cannot testify, nor make any representation or warranty, express or implied, to the accuracy, contents or data contained within this
document. While Angel Broking Limited endeavors to update on a reasonable basis the information discussed in this material,
there may be regulatory, compliance, or other reasons that prevent us from doing so.
This document is being supplied to you solely for your information, and its contents, information or data may not be reproduced,
redistributed or passed on, directly or indirectly.
Neither Angel Broking Limited, nor its directors, employees or affiliates shall be liable for any loss or damage that may arise from or
in connection with the use of this information.
Derivative Research Team derivatives.desk@angelbroking.com
